
close
Choose Your Site
Global
Social Media
Views: 0 Author: Site Editor Publish Time: 2025-09-10 Origin: Site
Many people see when the sky is hazy or clear. Aerosol optical thickness tells us how much tiny particles block sunlight. This number helps scientists learn about air quality and climate. It also shows how clean the air feels each day.
More than 55% of people in the world had higher PM2.5 from aerosols between 2010 and 2016.
Studies show aerosol optical thickness often guesses air pollution. But the link between this and real air quality can change in each city. Have you ever thought about why some days are easier to breathe than others?
Aerosol optical thickness shows how much tiny particles block sunlight. Low numbers mean the sky is clear. High numbers mean the air is hazy.
Knowing about aerosol optical thickness helps scientists watch air quality and climate change. This information can help people make better health choices and rules for the environment.
Many things like cities, factories, and nature change aerosol levels. Knowing where aerosols come from can help people fight pollution.
Satellites and ground tools give important data on aerosol optical thickness. This data helps guess air quality and helps with public health plans.
Learning about aerosols helps people make smart choices about air quality. Small steps can help make communities healthier and the environment better.
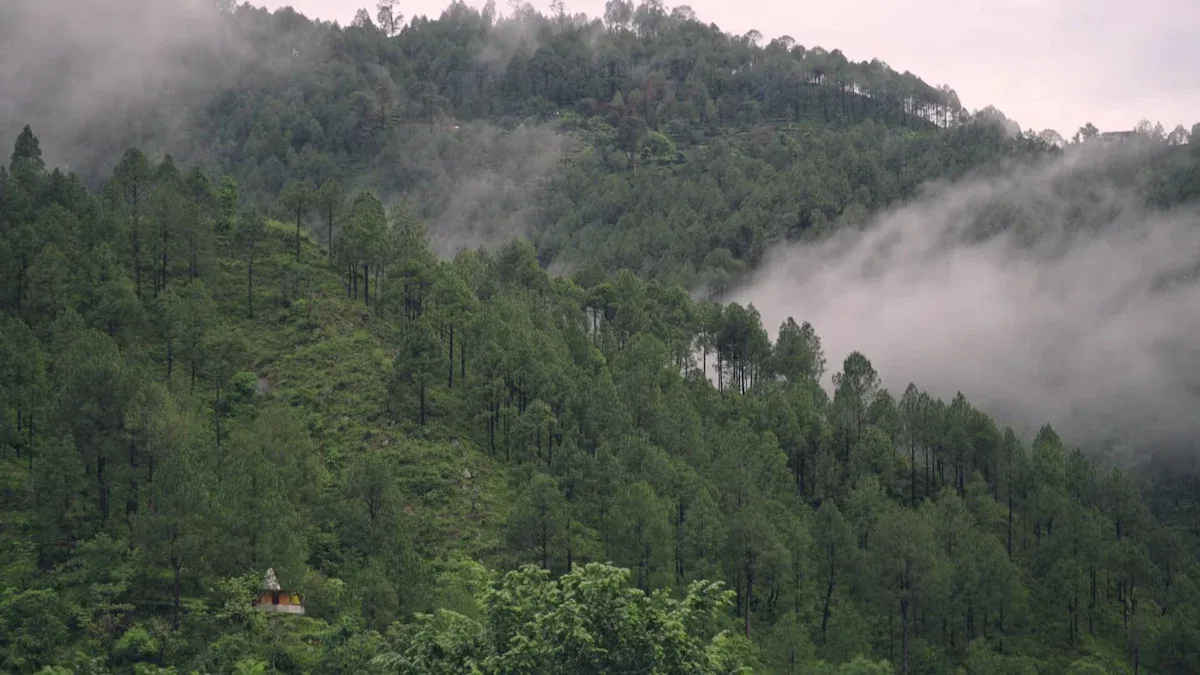
Image Source: pexels
Aerosol optical thickness tells us how much tiny particles block or scatter sunlight in the air. Scientists sometimes call this measurement optical depth. Optical depth shows how much light is stopped or scattered by aerosols from the ground up. This value does not have any units. It helps us know if the sky looks clear or hazy.
The size, shape, and number of aerosol particles affect aerosol optical thickness. If the optical depth is low, sunlight goes through easily, and the sky looks clear. If the optical depth is high, more sunlight is blocked, and the sky looks hazy. For example, values less than 0.1 mean the sky is very clear. Values close to 1 mean the air is very hazy, and it is hard to see far.
Scientists use optical depth to learn about air quality, climate, and how far we can see. They measure it with satellites and tools on the ground. These numbers help them see how aerosols change the environment.
Note: Aerosol optical thickness and aerosol optical depth mean the same thing.
Aerosol optical thickness is important for air quality, climate, and how far we can see. Changes in optical depth can change how far people can see. When aerosols take in more water, they scatter more light and make it harder to see. Even if some aerosols go down, visibility may not get much better because the types of aerosols can change.
The main things that cause high optical thickness are:
Cities and factories
Volcanic ash
Dust storms
Forest fires
Different places have different optical depth values. The table below shows the difference between cities and the countryside:
| Environment | Imaginary Part of Complex Refractive Index | Heating Rate (K d−1) |
|---|---|---|
| Urban | > 0.1 | 2.2 |
| Rural | ~ 0.068 | 1.50 |
Places in Europe and North America with lots of factories usually have lower optical depth. Countries in Asia and Africa often have higher optical thickness because of more cities and factories.
Aerosol optical thickness helps scientists watch changes in air quality and climate. It also helps people make choices about health and the environment. People who live where optical depth is high may see hazier skies and not be able to see as far. Watching these numbers helps communities fight pollution and stay healthy.
Scientists have different ways to measure optical depth in the air. Optical depth and aerosol optical thickness show how much sunlight is blocked or scattered by particles. Aerosol optical depth and PM2.5 are linked by layers of particles from the ground up. When particles mix well near the ground, the connection is strong.
Satellites are important for measuring optical depth. They use special tools to look at sunlight in different colors. modis is one tool that collects data in nine color bands from 440 to 1030 nm. Ground stations use sun-photometers and sky radiometers to check how much sunlight passes through. These tools also measure light in the sky near the sun. Scientists use computer codes to model the air and make tables for aerosol optical thickness.
Calibration makes sure the measurements are correct. The table below shows how ground stations check their tools:
| Calibration Method | Location | Accuracy | Notes |
|---|---|---|---|
| PHOTONS Calibration | Lille, France | AOD accuracy better than 0.01 | Master instrument calibrated by Langley plot analysis at Izana Observatory |
| Intercalibration of CARSNET | Izana Observatory | N/A | Used raw data from 1000 to 1400 local time on clear days, AOD < 0.20 on calibration day |
Satellites can see large areas but may not check often. Ground tools check more often but only in small places.
Optical depth numbers help people know how clear the air is. The graph shows that when aerosol depth goes up, you cannot see as far. If there are many particles, it is hard to see. When aerosol optical thickness goes down, you can see better.
The table below tells what the numbers mean:
| Aerosol Optical Thickness | Atmospheric Condition |
|---|---|
| < 0.1 | Crystal clear sky with maximum visibility |
| 1 | Very hazy conditions |
A number less than 0.1 means the sky is very clear. A number of 1 means the sky is very hazy. The time of year changes optical depth. In spring and summer, optical depth is higher. Fine mode particles are highest in summer. In fall and winter, optical depth is lower, and coarse mode particles are highest in winter.
People notice the air looks different in each season. For example, modis satellite pictures show higher optical depth in summer. Satellite data helps scientists watch these changes over time.
Optical depth numbers help people make choices about air and climate. They let communities know if the air is clean or dirty.
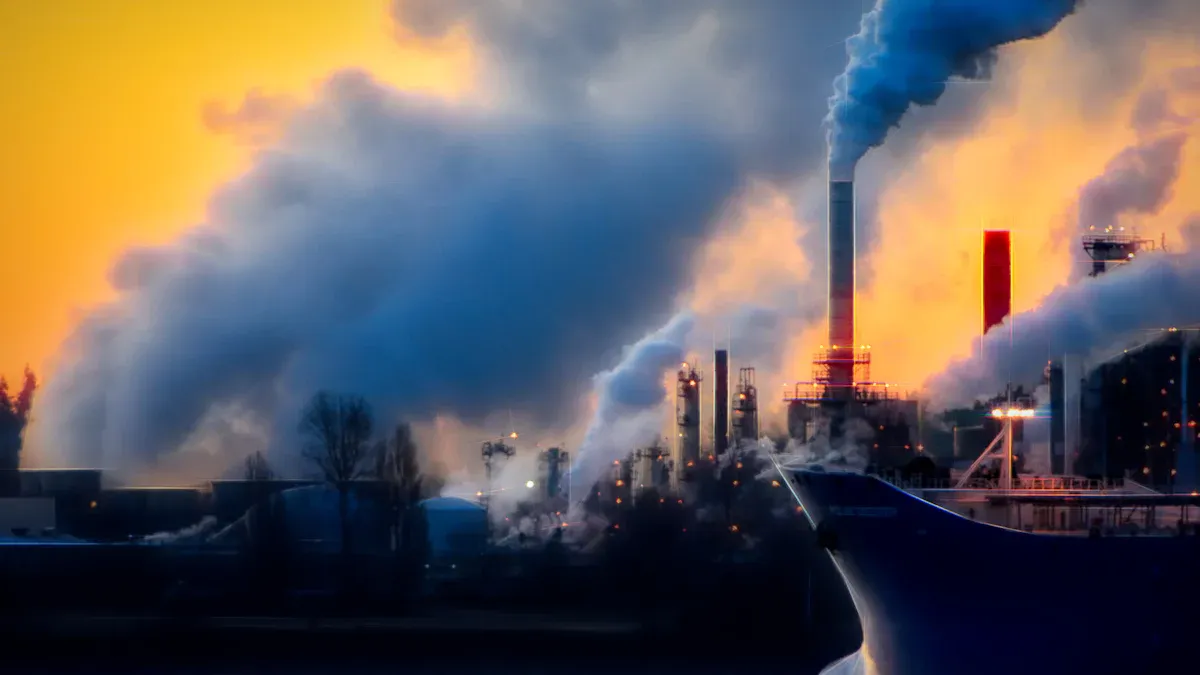
Image Source: unsplash
Aerosols are very important for the climate. These tiny particles in the air change how sunlight gets to the ground. Some aerosols bounce sunlight back into space, which cools the Earth. Others, like black carbon, soak up sunlight and warm the air. This warming can change the optical depth and affect how clouds form.
Aerosols can make the air warmer, which makes the atmosphere more steady. When the air is steady, there are fewer clouds.
If aerosols land on snow or ice, they make the ground darker. The ground then takes in more heat and melts faster.
Aerosols help clouds form by giving water and ice something to stick to.
The amount and type of aerosols change the optical depth. More aerosols can make clouds last longer and reflect more sunlight.
Clouds and the ground work together too. Warm air rising from the ground carries aerosols up to the clouds. This helps clouds form and can cool the Earth more. Different aerosols, like organic carbon or dust, change clouds in special ways. These changes can affect rain and snow.
Scientists watch aerosols to see how optical depth changes. These checks help make climate models better and improve climate predictions.
| Evidence Description | Impact on Climate Modeling |
|---|---|
| Changes in aerosol optical thickness (AOD) affect the Earth’s radiation balance, influencing climate change predictions. | Critical for understanding global climate change dynamics. |
| Variations in AOD can induce cooling or warming effects on the atmosphere. | Essential for accurate long-term climate modeling. |
| Monitoring AOD is vital for evaluating its effects on human health and the climate system. | Supports the need for precise climate predictions. |
Aerosols also change air quality and health. High aerosol optical thickness means more particles in the air. This can make it harder to breathe. Cities with high aerosol optical depth have more people with breathing problems. These problems include asthma, COPD, and lung cancer.
| Health Risk | Associated Condition | Source |
|---|---|---|
| Chronic Obstructive Pulmonary Disease (COPD) | Respiratory disease | Mowli and Subbayya 1989 |
| Asthma | Respiratory disease | Longo et al. 2011a |
| Lung Cancer | Respiratory disease | Kim and Criner 2013 |
| Deaths from Chronic Respiratory Diseases | Global health concern | World Health Organization 2007 |
| Major preventable chronic diseases | COPD, asthma, lung cancer | Bhome 2012 |
| Risk factors for asthma | Genetic, environmental, air pollutants | Oland et al. 2017 |
| Major risk factors for lung cancer | Cigarette smoking, air pollution | Petty 2005 |
Studies show a strong link between aerosol optical thickness and breathing sickness. More particles in the air mean more people get sick with lung and breathing problems. Watching optical depth helps cities check air quality and keep people safe.
Watching aerosol optical thickness helps make better health rules. By using these checks, health leaders can warn people about bad air sooner. This helps lower health risks and makes the air better for everyone.
Scientists use aerosol optical thickness to see how aerosols move. They look at satellite data to watch pollution from wildfires. Aerosol optical depth shows how much smoke covers big areas. This helps scientists know when and where wildfire smoke spreads. They can check how smoke changes air quality and health over time.
Volcanic eruptions also change aerosol levels. When a volcano erupts, it puts sulfur dioxide in the air. This gas turns into sulfate aerosols that stay for years. These aerosols reflect sunlight and can cool the Earth by about 0.5°C for up to three years. Scientists use aerosol data to follow these changes and learn how natural events affect climate.
In the last ten years, researchers saw different trends in aerosol optical thickness around the world.
| Observation | Trend | Region |
|---|---|---|
| Mean annual AOD | Decreased by up to 27% | Parts of the U.S. and Europe |
| Mean annual AOD | Increased by up to 22% | Countries with large economic growth |
These trends show how people and nature change the amount of aerosols in the air.
Aerosol data helps with public health and environmental choices. Scientists use this data in models to guess pollution levels.
A method uses MODIS pictures and aerosol optical thickness data in real-time forecasts. It uses AOT values from satellites to check air quality in Texas. These numbers match with ground air checks. Trajectories help predict what air will move into a region during the forecast.
Government agencies use aerosol data for many jobs:
Improve air quality checks and help public health plans.
Give details about regional air quality, especially about tiny particles.
Add data to systems to better understand pollution.
Help quick actions and policy changes to protect health and the environment.
Researchers use good ways to study aerosol data:
Use machine learning for cheaper predictions.
Use algorithms to make aerosol facts easier to read.
Think about local places, like land and ocean differences.
Mix satellite and airplane data to study aerosols in layers.
Make models bigger to cover more places and conditions.
Aerosol optical thickness helps scientists and leaders make smart choices for cleaner air and a better climate.
New studies show aerosol optical thickness is important for climate and air. Scientists learned that tiny particles can change weather and clouds. This also changes how much energy the Earth gets. People can join projects like CEAMS to check air quality at home. They can see how pollution changes over time. There are many resources to help students and families learn about aerosols. These resources explain how aerosols affect health, climate, and the environment. Everyone can help by watching air quality and learning more. Small changes in the air can change how we feel every day.
| Application | Description |
|---|---|
| Air Quality | Seeing how aerosols change the air people breathe |
| Health and Environment | Learning about health risks from dirty air |
| Climate Change | Studying how aerosols change weather and climate |
Learning about air and taking small steps can help make communities healthier and the future better.
Aerosol optical thickness tells us how much sunlight is blocked by particles in the air. PM2.5 counts tiny particles that are smaller than 2.5 micrometers. Both show if the air is clean or dirty, but they use different ways and units to measure.
Yes, people can often notice these changes. When aerosol optical thickness is high, the sky looks hazy or gray. When it is low, the sky looks clear and blue. It is also harder to see far away when the value is high.
Scientists use this data to watch pollution and study climate change. They also use it to warn people about bad air. They look at pictures from satellites and check tools on the ground. This helps keep people and nature safe.
Weather can change aerosol optical thickness. Rain can clean the air and make the value lower. Wind can bring dust or smoke and make the value higher. The time of year also changes these numbers.
Aerosol optical thickness changes the air we breathe. High values can make it hard to see and breathe. Learning about it helps students know more about pollution and climate. Students can use this to make good choices and help their communities.


